It’s that time of year when Spoon Graphics gets a little older, with 2020 marking 13 years of tutorial creating, freebie sharing and article writing on what started as a blog that was attached to my portfolio website in 2007. Every April I take some time to reflect on the past 12 months and talk about how things have changed. Last year I talked about how much the landscape of the Internet has changed since I started Spoon Graphics and my worry for what the future might hold, so let’s take a look at the latest stats and figures and see how things are going another year on.
I always start these anniversary posts with links to my previous yearly celebrations. It’s interesting to go back and see how my blog has evolved:
- Spoon Graphics Turns 12 Years Old — What Does the Future Hold?
- Spoon Graphics Turns 11 Years Old — Down But Not Out!
- Spoon Graphics Turns 10 Years Old — A Decade of Blogging!
- Spoon Graphics Turns 9 – The Growth Was Incredible This Year
- Blog.SpoonGraphics Turns 8 – Onwards and Upwards
- Blog.SpoonGraphics Turns 7 – Surviving the Apocalypse
- Blog.SpoonGraphics Turns 6 Years Old – Staying Fresh
- Blog.SpoonGraphics Turns 5 Years Old – Thank You!
- Blog.SpoonGraphics Turns 4 – A Look Back in Time
- Blog.SpoonGraphics Turns 3 – Win Yourself a Poster!
- Two Years of Blog.SpoonGraphics
- One Year of Blog.SpoonGraphics
Spoon Graphics Traffic Stats
Traffic change: -23%
Top Content: 25 Adobe Illustrator Brush Sets You Can Download For Free (2016) & 45 T-Shirt Mockup Templates You Can Download for Free (2017) (NEW)
Email Subscribers: 189,773 (up 14% from 2019)*
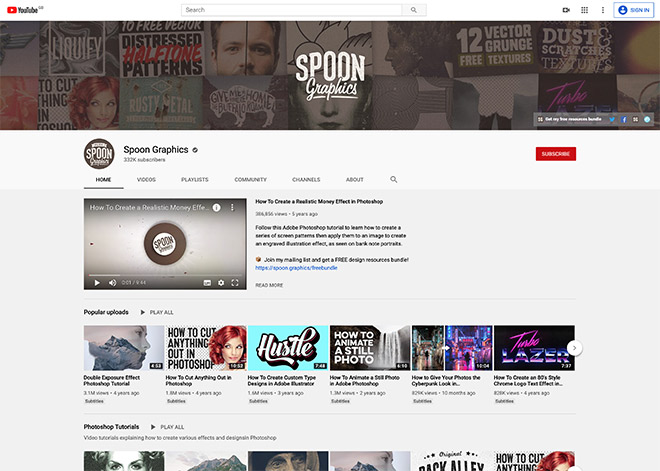
YouTube Channel Subscribers: 332,014 (up 30% from 2019)
Highest Traffic Peak (This Year): Tuesday May 14th 2019 – 17,517 visitors (10 Distressed Vector Halftone Patterns for Illustrator)
Highest Traffic Peak (All Time): Tuesday November 11th 2014 – 44,592 visitors (How To Create a Realistic Painted Effect in Photoshop)
*I gave my mailing list a spring clean which removed almost 65,000 inactive subscribers, so that total figure would have been even larger!

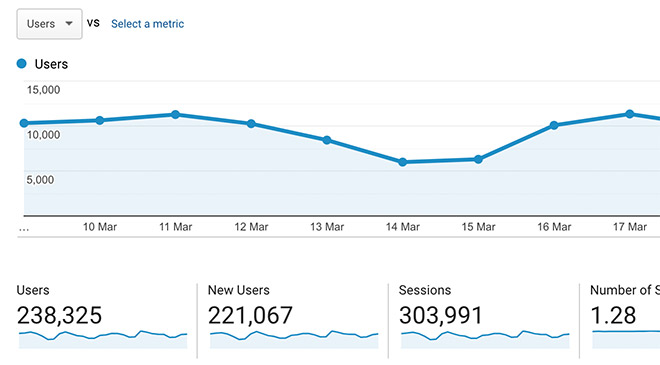
Unfortunately, traffic levels have nosedived this year by the largest amount ever with a 23% reduction in visitors, taking me back to the kind of figures I was getting in 2008, just a year after creating Spoon Graphics. That’s down -56% from its peak in 2012. The biggest factor seems to be a 30% decrease in Google Search traffic, which might explain why there’s a new entry in my Top Content this year. My roundup of 20 Free PSD Templates to Mockup Your Poster Designs had been my most-trafficked content for several years until it dropped to 2nd place last year. In its place is a roundup of T-Shirt mockup templates from 2017, so it seems like Google might have dropped many of my older posts from their established search rankings.

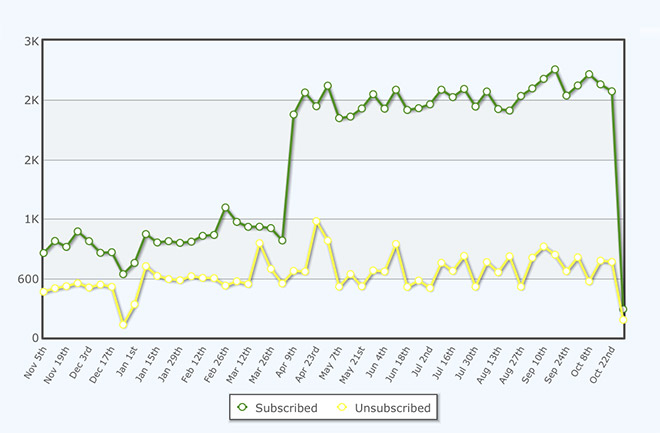
While traffic levels have plummeted, it is good to see my subscriber counts are continuing to rise, by an additional 24,000 email subscribers, and 77,000 YouTube subscribers. One success story I have to share is a tweak to one of my newsletter signup forms that tripled my daily new subscriber rate! Previously, a popup window prompting users to subscribe to receive my free bundle would appear when they had clicked to download one of my resources. It was my most successful signup form, but it appeared after the file was supplied. I’ve never wanted to make it mandatory to supply an email address in order to download an item, so instead I made a ‘forced interaction’ popup, which appears the first time someone clicks a download. It asks whether you want ALL my resources in one go by subscribing or to just download that individual file. The signup stats clearly show a huge increase in new subscribers, with only a minimal increase in the number of unsubscribes.

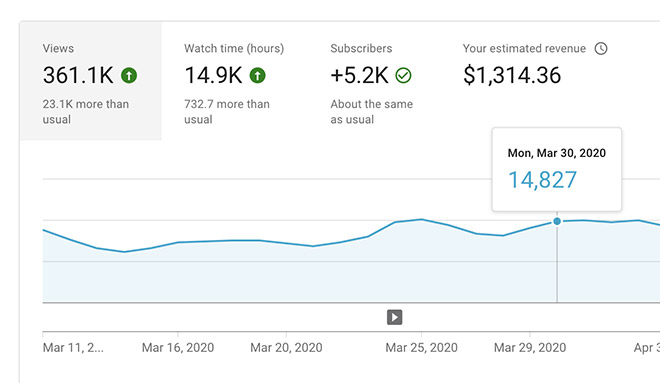
Views stats over at my Spoon Graphics YouTube Channel had also been in a slow decline in mid-2018 to early-2019, but thankfully I struck gold with the YouTube algorithm with a tutorial titled How to Give Your Photos the Cyberpunk Look in Photoshop. Within a week my channel saw a large spike in views that set a new all-time high. It was short-lived as traffic returned to normal by the end of the month, but I’ve seen a steady trend upwards in views since.
Technical stats
Powered by: WordPress
Hosted on: Bare Metal Server (NEW)
Server location: Dallas
Monthly bandwidth: 13TB
Average running costs: $1870 per month (up 22% from 2019)
My server setup was upgraded again this year, this time from a VPN to a Bare Metal Server setup. Even though I previously upgraded to a 10TB bandwidth package, I was still seeing overage charges every month due to the sheer number of free downloads I host. A deal came up on a Bare Metal Server with a 20TB bandwidth limit, which has saved me a large chunk of money each month by avoiding those overage charges. Despite this, growth in my mailing list has still resulted in a 22% increase in costs!
Website vs YouTube?
One of the difficult decisions I now have is how I should divide my time between my Spoon Graphics website and my Spoon Graphics YouTube Channel. The subscriber and view stats on YouTube are dramatically outperforming my website, so maybe that’s where the future lies for Spoon Graphics? On the other hand, it’s this Spoon Graphics website that allows me to pay the bills and earn a living through the Access All Areas membership, the affiliate promotions I send out to my mailing list, and the recent paid products I released. It sounds like I need to think of ways to funnel those 300,000 YouTube subscribers over to Spoon Graphics! As always, thank you to all my readers, from veteran subscribers who have been around since the early days, to newcomers who have just discovered my content. I appreciate all your support!
The post Spoon Graphics Turns 13 Years Old — Traffic Down, Subscribers Up! appeared first on Spoon Graphics.

0 Comments